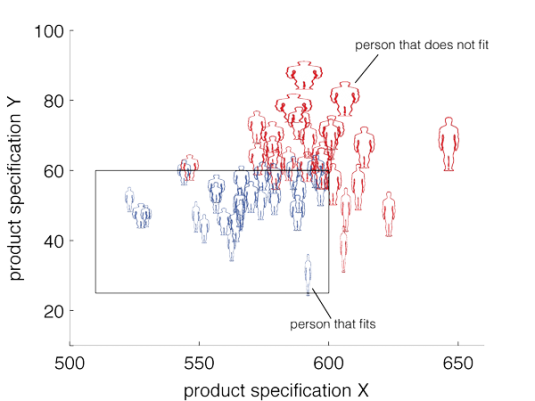
From simple color-coding to more intricate forms like the “Chernoff face”, glyphs are a means of visualizing multidimensional data. The spatial design of products for their users presents a unique opportunity for using glyphs as a visual metaphor for encoding data, chiefly due to the multivariate nature of many commonly encountered problems. While relatively intricate glyphs called “Digital Human Models” (DHMs) have been studied for the evaluation of user fit in the design of products for decades, they typically only exist as an illustration within the physical environment. However, the current paper explores a novel strategy of positioning simple humanoid figures in relational graphs (e.g., scatter plots) to facilitate decision making in multidimensional design scenarios. This technique is particularly useful when used in combination with a quantitative optimization technique called “virtual population fitting”. Results from a web- based survey with 94 participants compare the intuitiveness of two types of humanoid representations and the comprehension of glyphs to solve problems involving human variability.

